Interaction-first
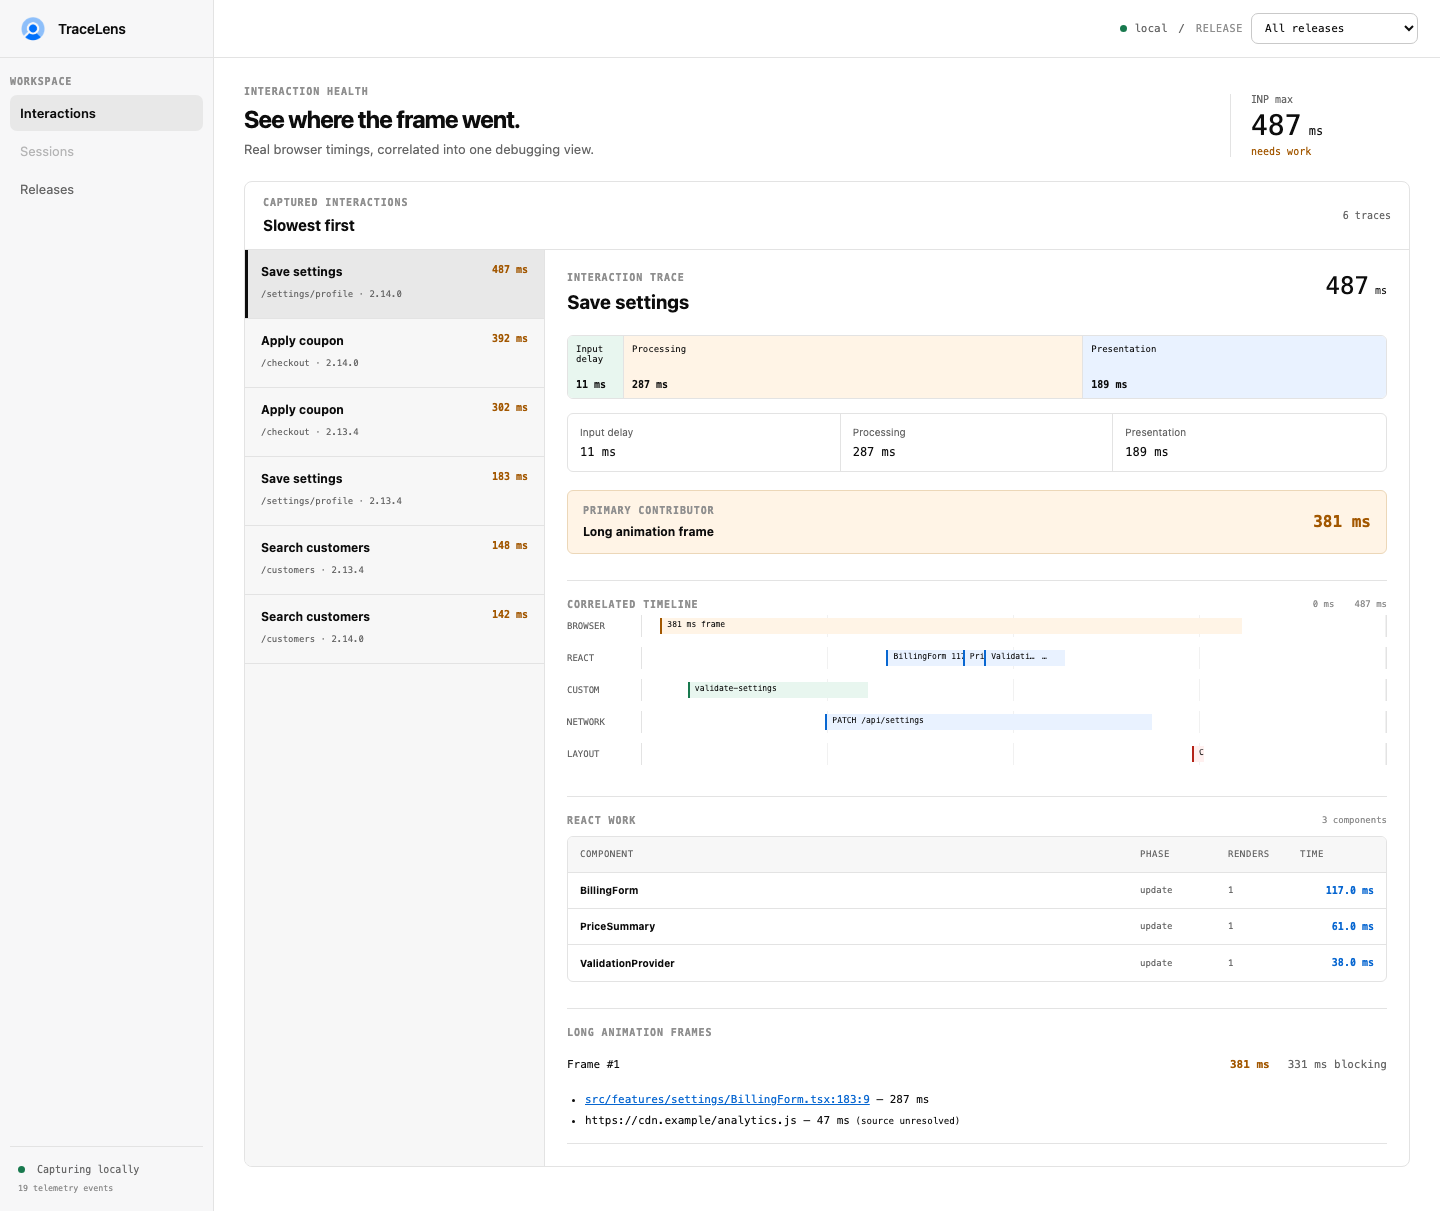
Break responsiveness into input delay, processing, and presentation—and connect the result to overlapping browser work.
Correlate INP, long frames, React renders, network work, source maps, and release regressions in one local-first debugging workflow.

TraceLens is built for the question a score cannot answer: what actually made this interaction slow? Start at a user-visible delay, follow its correlated work, then compare the same signal across releases.
npm install @leracherry/tracelens-browser
npx @leracherry/tracelens-cli@1.0.0 studio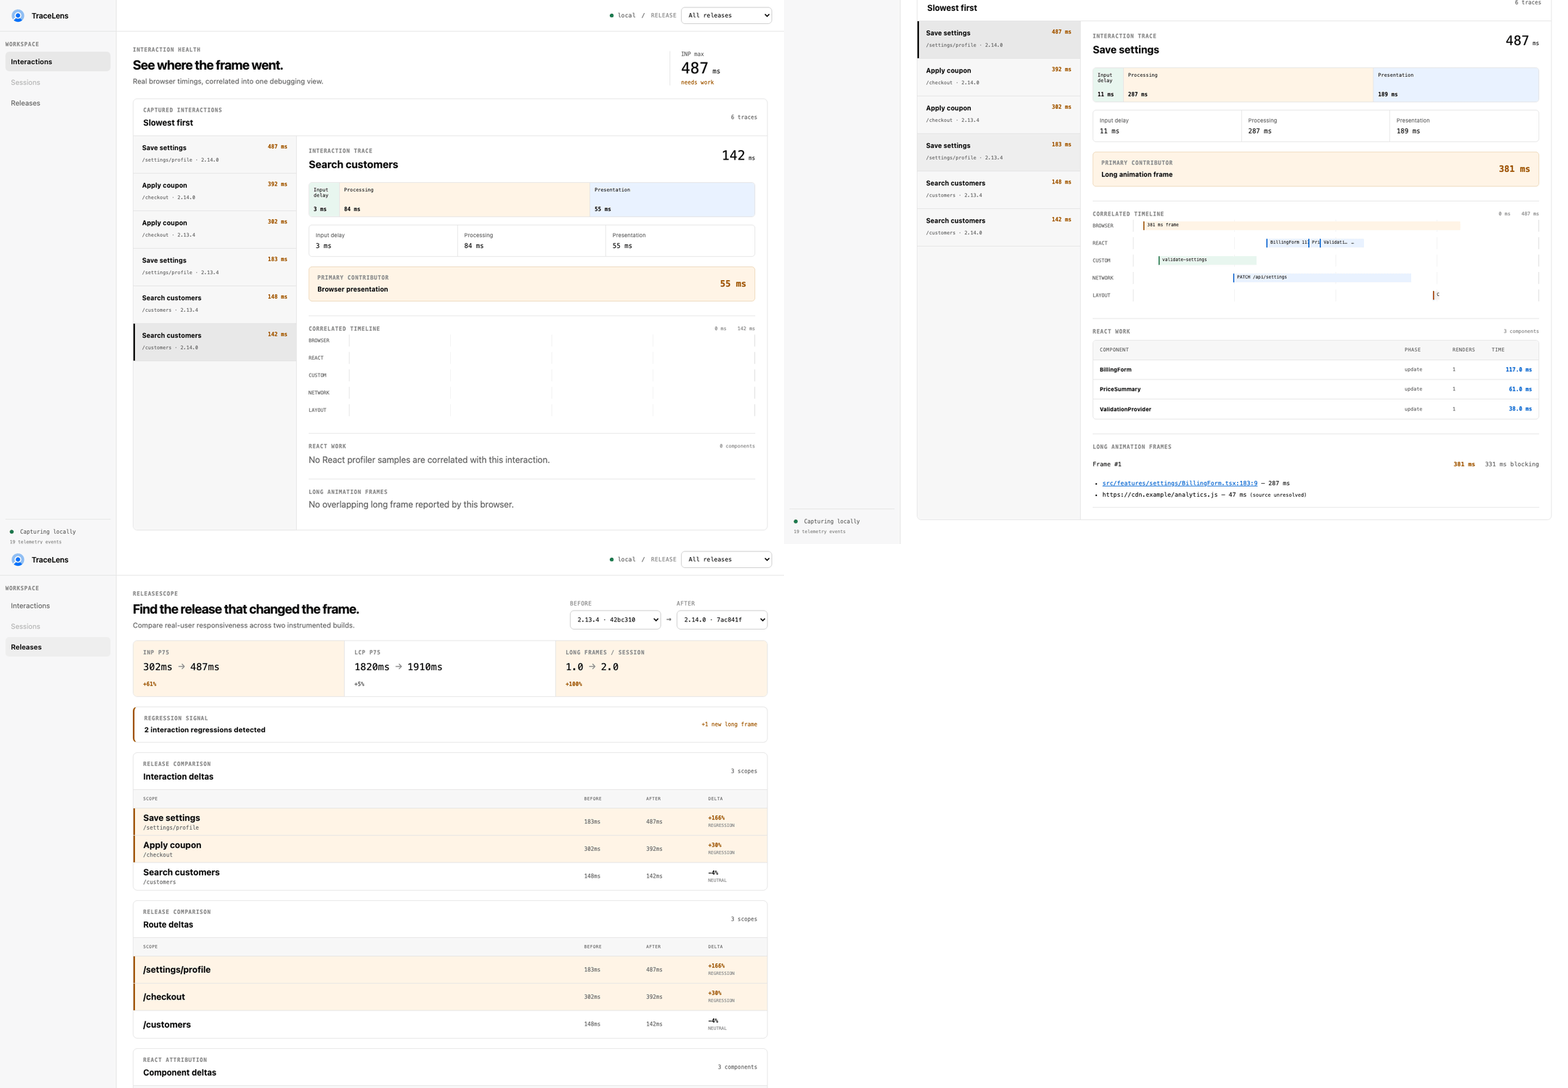
Captured from the real Studio UI using synthetic telemetry. Each view is held for three seconds. Collapse this section to hide the animation; the image above is a static alternative. Reproduce the capture.
Contribute · Code of Conduct · Report a vulnerability privately
Define release and route budgets in YAML, evaluate captured telemetry locally, then run the same engine in pull requests.
- uses: leracherry/tracelens@v1.0.0
  with:
    trace-file: artifacts/tracelens-events.json
    github-token: ${{ secrets.GITHUB_TOKEN }}