
Debug a slow interaction
This walkthrough uses the TraceLens Playground to move from a slow click to a concrete explanation, then turns that finding into a release budget.
Start Studio and the playground
git clone https://github.com/leracherry/tracelens.git
cd tracelens
pnpm install
pnpm dev
Open the playground at http://localhost:4174 and Studio at http://localhost:4173. Keep both tabs visible so the newest event is easy to identify.
Reproduce one controlled failure
Choose Settings save, select 1×, and run it once. Then open the newest Save settings interaction in Studio.
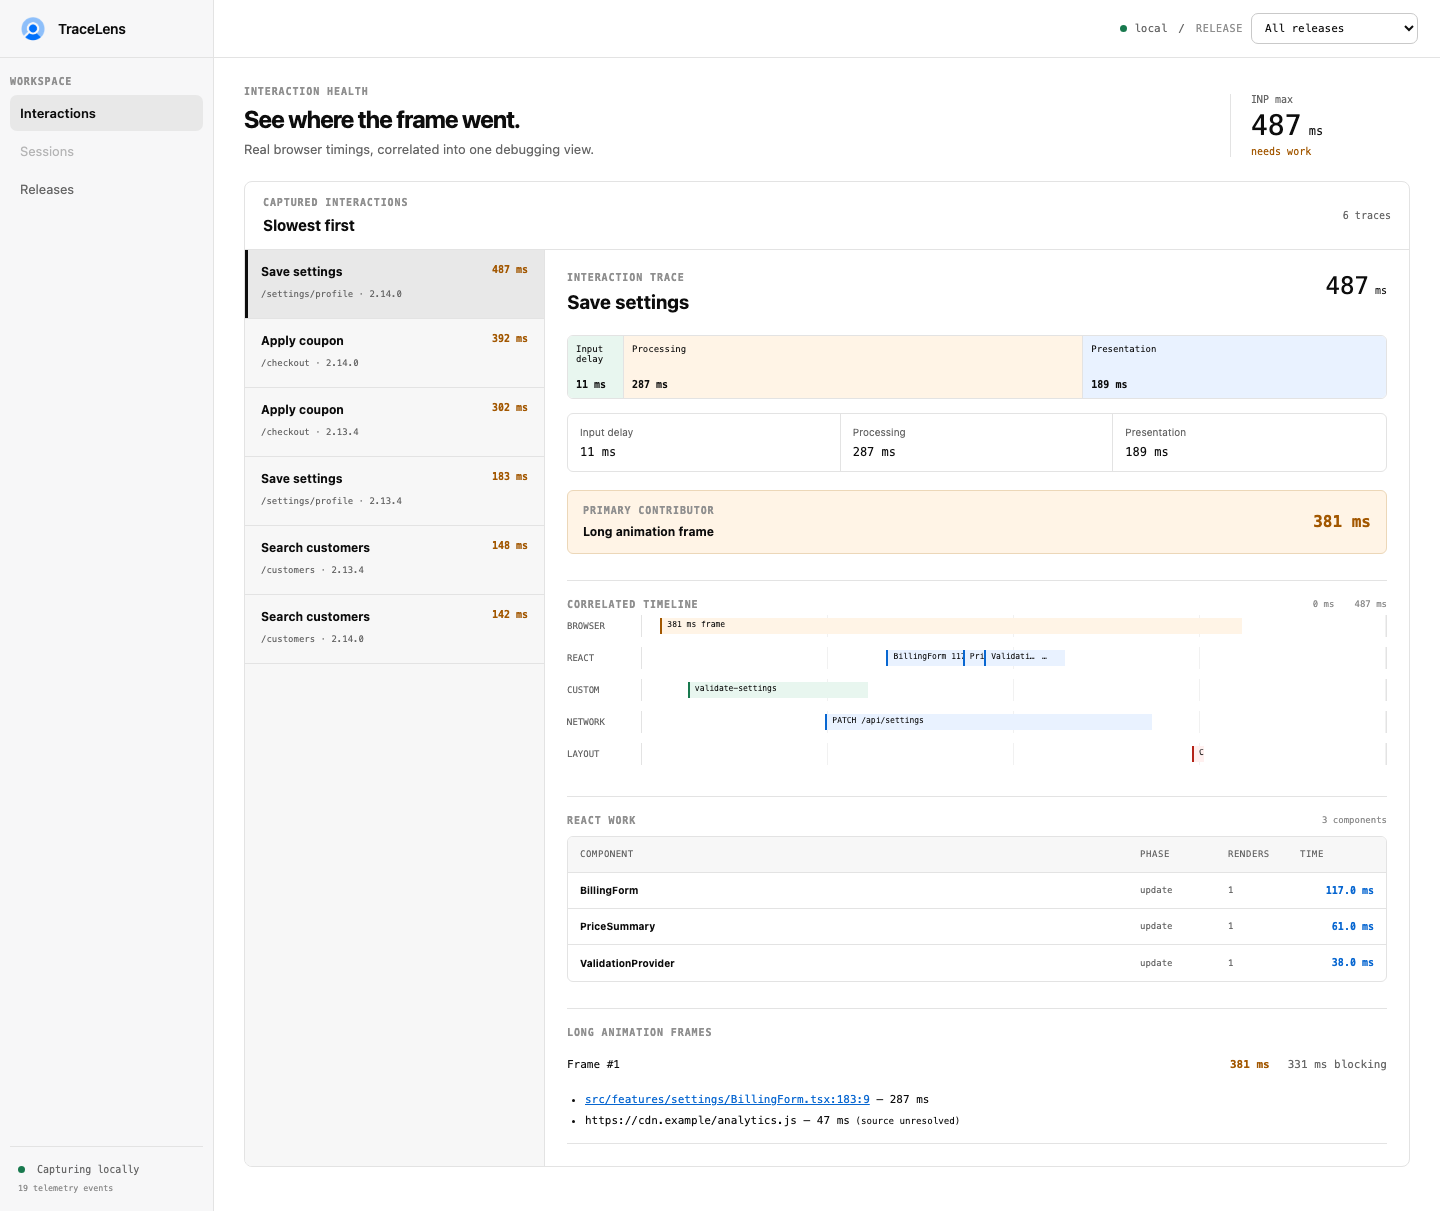
The example interaction takes 487 ms. Do not begin with the aggregate score; begin with the timing split:
| Subpart | Question | Typical next move |
|---|---|---|
| Input delay | What blocked the main thread before the handler began? | Inspect work immediately before processing. |
| Processing | What did the handler execute synchronously? | Inspect custom spans, React commits, and long-frame scripts. |
| Presentation | What delayed the next painted frame after the handler? | Inspect rendering, style/layout, and follow-up work. |
In this trace, processing is the largest named segment. That makes synchronous handler work and the overlapping long frame stronger leads than the PATCH request.
Follow correlated work
Read the timeline from the interaction outward:
- Select the long frame overlapping the processing interval.
- Compare total duration with blocking duration; blocking is the portion beyond the responsiveness allowance.
- Inspect first-party script contributors. With uploaded source maps, open the original file location rather than a generated bundle offset.
- Check React commits during the same interval. A high actual duration or repeated render count points to UI work; absence of a costly commit shifts attention back to application code.
- Treat the network lane as causal only when its timing supports that claim. A request can share the initiating interaction ID but finish after the INP interval.
Correlation is evidence of shared initiation or overlap, not proof that every span caused the delay.
Confirm the hypothesis
Run Settings save again at 0.7×, 1×, and 1.4×. The absolute numbers vary by browser and hardware, but a valid hypothesis should preserve its shape: the suspected custom span or long-frame contributor should grow with the interaction's processing time.
Use the other scenarios to practice distinguishing shapes:
| Scenario | Simulated problem | Strongest signals |
|---|---|---|
| Slow search | Large synchronous filter | Processing, custom span, long frame |
| Slow checkout | Delayed POST and render fan-out | Network span, follow-up frame, React |
| Layout thrash | Repeated geometry reads and writes | Presentation, layout shifts, long frame |
| Third-party block | Synchronous analytics initialization | Third-party script contribution |
Compare the release
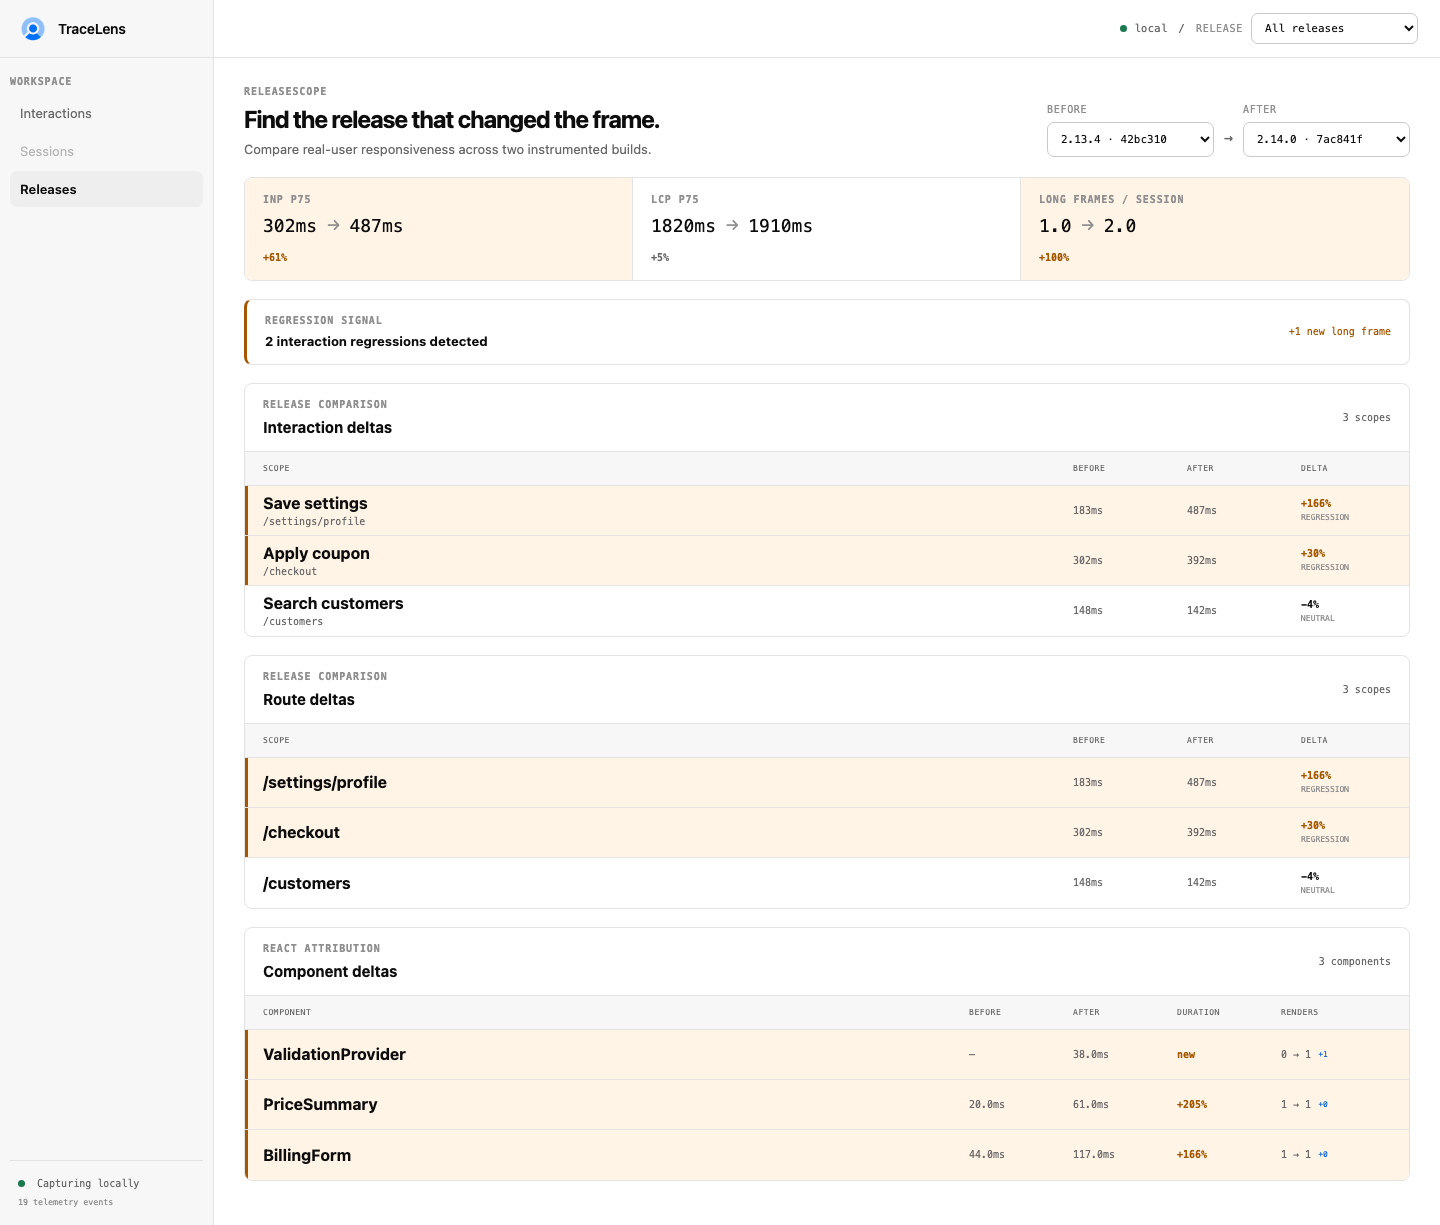
Capture representative before/after samples with stable app, environment, route, interaction names, and React boundary names. Then compare them:
npx @leracherry/tracelens-cli@1.0.0 compare 2.13.4 2.14.0 \
  --file trace.json
ReleaseScope ranks the interaction, route, and component deltas. It describes the supplied sample; it does not prove statistical significance or normalize different traffic populations.
Prevent the regression
Once the population is representative, define a budget for the affected route:
minimumSamples: 20

performance:
  inp:
    p75: 200

routes:
  /settings:
    inp:
      p75: 180
Check it locally:
npx @leracherry/tracelens-cli@1.0.0 budget check \
  --config tracelens.yml \
  --file trace.json \
  --release 2.14.0 \
  --app playground \
  --environment production
Then move the same check into the GitHub Action. Insufficient samples fail closed, so missing telemetry cannot silently approve a release.
What a useful finding looks like
A good TraceLens investigation ends with a falsifiable statement, not merely a red score:
Save settings regressed in 2.14.0 because
validateSettingsadded roughly 280 ms of first-party synchronous work inside the interaction's processing interval. The PATCH completed later and was correlated, but did not account for the INP delay.
That statement tells an engineer what to change, what not to blame, and which budget will catch a recurrence.